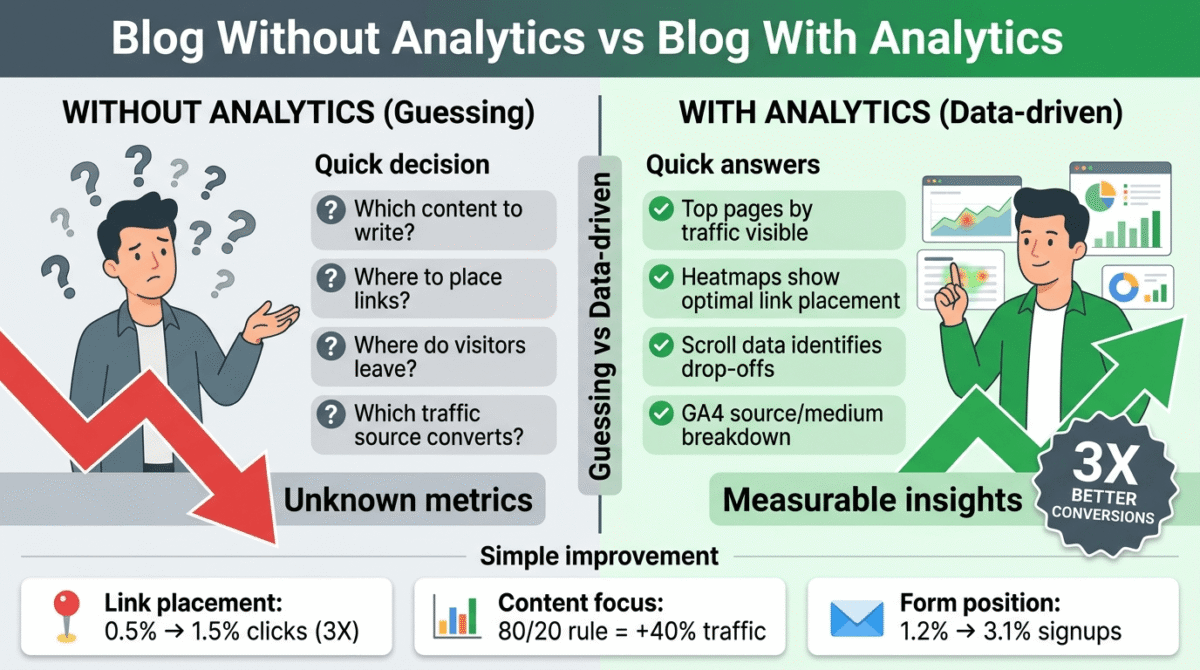
You cannot improve what you cannot measure. Every blogger who publishes content without analytics is flying blind not knowing which posts drive traffic, which pages convert readers into email subscribers, where visitors drop off, or which traffic sources actually send buyers versus browsers.
Website analytics tools answer these questions. They show you what is working, what is not, and, critically, why visitors behave the way they do on your site. The data from analytics tools is the difference between guessing what content to create next and knowing with confidence what your audience actually wants.
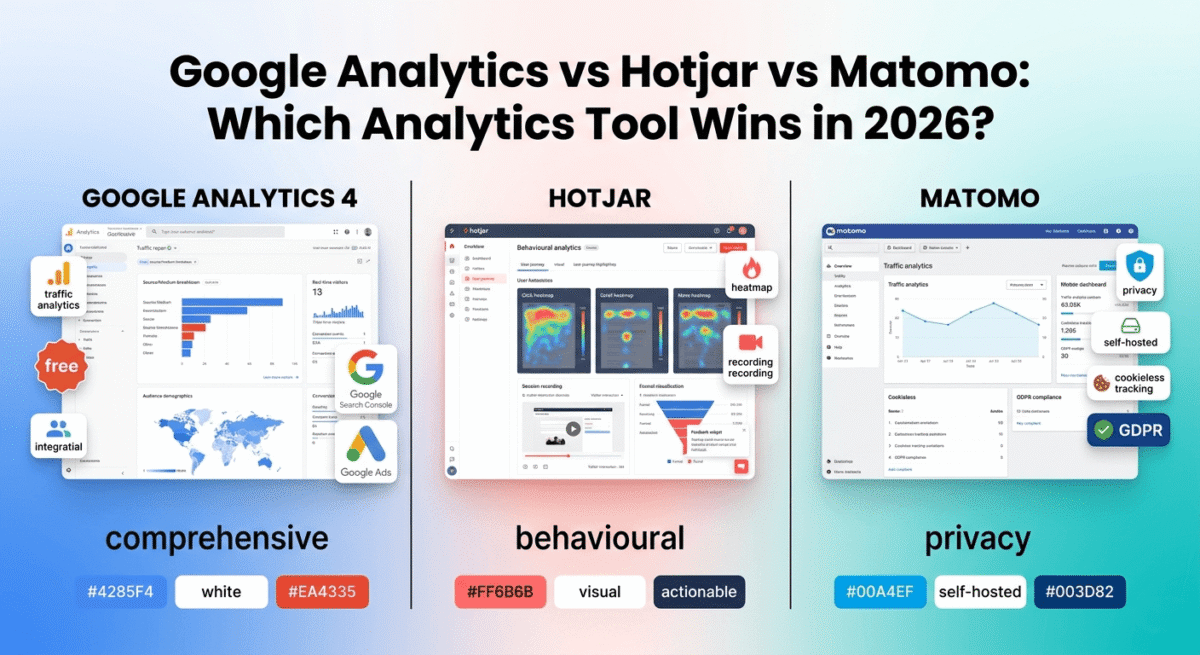
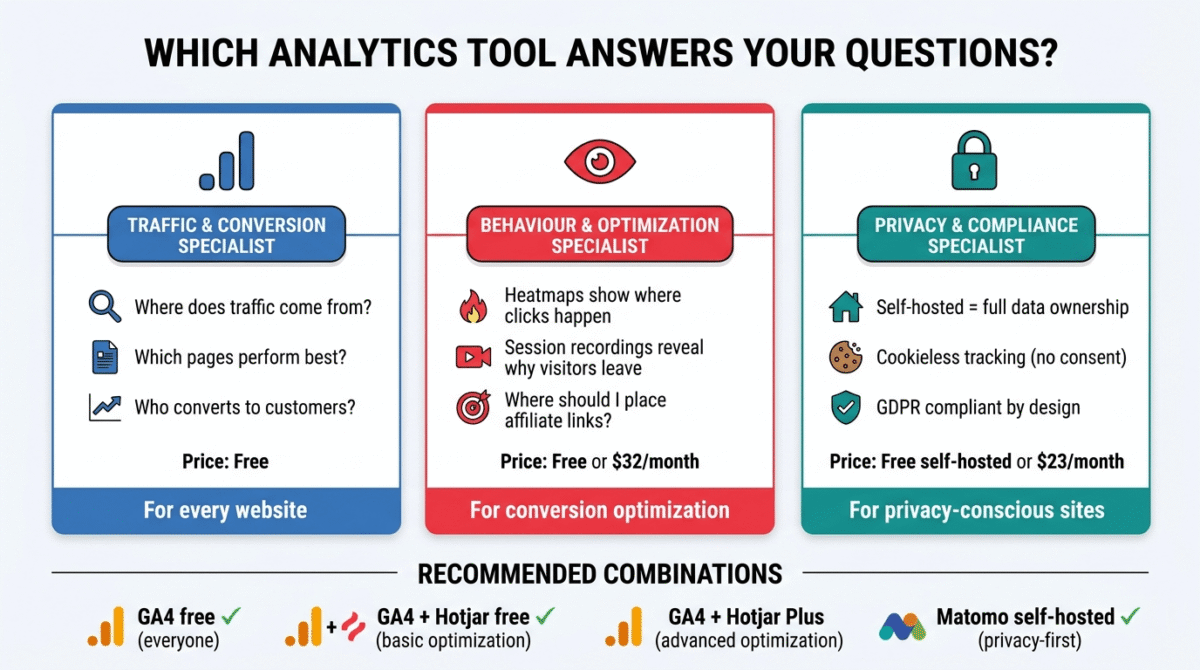
In 2026, three tools define the website analytics landscape: Google Analytics 4 (the universal standard), Hotjar (the behaviour analytics leader), and Matomo (the privacy-first alternative). They are not competitors in the traditional sense, each answers different questions about your website’s performance. Understanding what each tool does best determines which combination serves your specific needs.
I tested all three (Google Analytics vs Hotjar vs Matomo) for 60 days across real websites with real traffic, a software review blog, an e-commerce store, and a lead generation site. Here is the honest comparison.
Table of Contents
How We Evaluated These Tools
Every platform was tested across five criteria:
– Traffic analytics, accuracy and depth of visitor, session, and traffic source data
– Behaviour analytics, heatmaps, session recordings, and user journey analysis
– Conversion tracking goal setting, funnel analysis, and revenue attribution
– Privacy compliance, GDPR, CCPA, and cookieless tracking capabilities
– Value free plan quality and paid plan pricing versus features offered
Why Analytics Matter More Than Ever for Bloggers in 2026
Before comparing the tools, a brief case for why analytics deserve more attention than most bloggers give them.
Traffic source understanding: Knowing that 60% of your traffic comes from Google, 20% from Pinterest, and 15% from email is actionable information. If Pinterest traffic converts to email subscribers at 3x the rate of Google traffic, you invest more in Pinterest. Knowing this enables you to scale your distribution velocity using centralized social publishing engines to feed the highest-converting networks effortlessly.
Content performance data: Your blog’s top 10 pages by traffic are probably not the pages you would guess. Analytics consistently reveals that readers care most about content that does not match what the writer expected, a frequently cited statistic is that 80% of blog traffic goes to 20% of posts. Knowing which 20% tells you where to focus updating, promoting, and internally linking.
Conversion funnel analysis: For bloggers selling courses, digital products, or affiliate products, understanding where in the purchase journey visitors abandon is the most valuable optimisation data available. For example, if you track users exiting right at your checkout gate on premium hosted course frameworks, your analytics environment lets you diagnose the friction. Are visitors adding to cart but not checking out? Reading your sales page but not scrolling to the pricing section? Analytics answers these questions.
AdSense optimisation: Google Analytics shows which pages generate the most pageviews, time-on-page, and repeat visits, data that directly informs where placing AdSense units generates the most impressions and therefore the most revenue.
Google Analytics 4 Review: Best Traffic Analytics, Free and Essential
Free plan: Yes, completely free, no limits
Starting paid price: Google Analytics 360 – $150,000+/year (enterprise only)
Best plan for most users: Free version, covers everything bloggers and small businesses need
Platforms: Web, iOS, Android (Firebase integration)
Affiliate program: None, Google Analytics is a free Google product
Google Analytics 4 (GA4) is the world’s most widely used website analytics platform, installed on over 32 million websites globally. It is free, connected to Google Search Console and Google Ads, and provides the most comprehensive traffic data available to website owners. For bloggers, GA4 is not optional, it is the foundational analytics tool that every other tool complements rather than replaces.
What Google Analytics 4 does best
GA4’s traffic analytics are the most comprehensive of the three tools. The Acquisition reports show exactly where every visitor came from, organic search (with keyword data when connected to Search Console), direct traffic, referral sites, social media platforms, email campaigns, and paid advertising, broken down by source, medium, and campaign with user counts, session counts, engagement rates, and conversion data for each.
The real-time report shows who is on your site right now, how many active users, which pages they are viewing, where they came from, and what device they are using. For bloggers who have just published a post or sent an email newsletter, real-time data confirms whether the content is driving immediate traffic.
GA4’s audience reports reveal who your visitors are, geography (country, city, region), device (mobile, desktop, tablet), browser, operating system, and language. For a software review blog targeting global English-speaking audiences, understanding that 40% of your traffic comes from India, 25% from the US, and 15% from the UK tells you which AdSense markets to prioritise and which content angles to emphasise.
The Pages and Screens report shows which content performs best, pageviews, unique pageviews, average engagement time, and bounce rate per page. Sorted by pageviews, this report immediately reveals your top 10 traffic-driving posts, the content you should update regularly, promote heavily, and internally link to from newer posts.
GA4’s conversion tracking, called Events, tracks any action visitors take on your site: clicking an affiliate link, submitting an email opt-in form, completing a purchase, watching a video, scrolling to a certain depth, or clicking a specific button. Setting up conversion events tells you not just how many visitors your site receives, but what percentage of them take the actions that matter to your business.
The integration with Google Search Console, free, adds keyword-level data to your analytics: which search queries bring visitors to each page, your average position for those queries, and the click-through rate. For SEO-focused bloggers, this integration is one of the most valuable free data sources available. To truly scale this data footprint, utilizing comprehensive search volume analytics suites allows creators to identify competitor search market share and locate hidden link horizons.
GA4’s Explore section enables custom analysis, funnel exploration (tracking visitors through a multi-step conversion process), path exploration (seeing what pages visitors navigate through during a session), segment overlap (comparing behaviour between different audience groups), and cohort analysis (tracking how groups of users acquired on a specific date behave over time). These analyses require no coding, they are point-and-click within the GA4 interface.
Where GA4 falls short
GA4’s transition from Universal Analytics (the previous version) in 2023 created significant confusion, the interface was redesigned, metrics were renamed, and historical data did not carry over. Many bloggers who learned Universal Analytics feel less comfortable in GA4, and the interface, while powerful, is less intuitive than its predecessor.
GA4 does not show you what visitors do on individual pages, it shows aggregated data (average scroll depth, average engagement time) but not individual session recordings, click heatmaps, or move heatmaps. Understanding why a page converts poorly requires Hotjar, not GA4.
GA4’s data sampling, applied to accounts with high traffic volumes, can reduce accuracy in custom reports. For most bloggers with under 500,000 monthly sessions, sampling is not an issue. For high-traffic sites running complex custom reports, sampled data reduces analytical precision.
Privacy regulations have complicated GA4’s cookie-based tracking model. GDPR in Europe and similar regulations globally require cookie consent banners, and visitors who decline cookies are excluded from GA4 data, creating gaps in traffic data that privacy-respecting consent implementations can make significant. Matomo addresses this better than GA4.
Google Analytics 4 pricing
Google Analytics 4 is completely free for standard use. Google Analytics 360, the enterprise version with SLA guarantees, unsampled data, and dedicated support, costs $150,000+/year and is relevant only to enterprise organisations with millions of monthly sessions.
Google Analytics 4: Pros and Cons
Pros:
– Completely free, no cost at any traffic volume for standard use
– Most comprehensive traffic data, source, medium, campaign, geography, device
– Native integration with Google Search Console for keyword-level data
– Native integration with Google Ads for paid campaign tracking
– Real-time reporting for immediate traffic monitoring
– Conversion event tracking for any on-site action
– Custom Explore reports for advanced analysis
– Universal adoption, most third-party tools integrate with GA4
Cons:
– Interface less intuitive than Universal Analytics, steep re-learning curve
– No individual session recordings or heatmaps
– Data sampling on high-traffic custom reports
– Cookie consent requirements create data gaps in GDPR regions
– Privacy concerns, data sent to Google’s servers
– GA4 transition broke historical data continuity for many sites
Rating: 4.7 / 5, Essential free analytics for every website. Not optional for any blogger serious about understanding their traffic.
Hotjar Review: Best Behaviour Analytics Tool
Free plan: Yes, 35 daily sessions recorded, unlimited heatmaps
Starting paid price: $32/month (Plus, billed annually)
Best plan for most bloggers: Plus, $32/month (billed annually)
Platforms: Web
Affiliate program: Yes, Hotjar affiliate program, 25% recurring commission
Hotjar is the world’s leading behaviour analytics tool, it shows you not just how many people visit your pages (GA4’s domain) but what they actually do when they get there. Heatmaps show where visitors click, where they move their mouse, and how far they scroll. Session recordings show individual visitor journeys, every click, scroll, form interaction, and navigation decision, in video playback. Feedback tools ask visitors directly why they did or did not complete an action.
What Hotjar does best
Hotjar’s heatmaps are its most immediately actionable feature. Three types of heatmap reveal different dimensions of visitor behaviour:
Click heatmaps show where visitors click on a page, including clicks on elements that are not links. Seeing visitors repeatedly click on a non-clickable element (an image they assume is a button, a heading they think is a link) immediately reveals a usability problem. For affiliate bloggers, click heatmaps show whether visitors are actually clicking your affiliate links or ignoring them, data that directly informs link placement decisions.
Scroll heatmaps show how far down the page visitors scroll before leaving. If your affiliate disclosure, your product recommendation, or your email opt-in form is positioned below the point where 70% of visitors stop scrolling, you discover this immediately from a scroll heatmap. Moving the most important elements above this threshold is the single most common conversion improvement that heatmap analysis reveals.
Move heatmaps track where visitors move their mouse, which correlates with where they read and what captures their attention. For content optimisation, move heatmaps reveal which sections of a page visitors engage with most, informing where to place your strongest arguments and clearest calls to action.
Session recordings are Hotjar’s most powerful tool for understanding conversion problems. Rather than inferring behaviour from aggregated data, you watch individual visitors navigate your site in real time, seeing where they hesitate, what they re-read, where they get confused, and at what exact moment they decide to leave. For a blogger whose affiliate link is not converting, five session recordings of visitors reading the relevant review page often reveal the exact objection or confusion preventing clicks. This granular level of behavioral insight is equally vital when constructing performance-built squeeze page structures to ensure users focus entirely on your primary CTA.
Hotjar’s Funnels tool visualises drop-off rates at each step of a conversion process, how many visitors make it from your homepage to your sales page, how many from your sales page to your checkout, how many from checkout to purchase confirmation. Each drop-off point is a conversion problem waiting to be diagnosed with session recordings and heatmaps.
The Feedback widget, a small button on your site that visitors can click to leave a star rating and written comment, collects qualitative data that quantitative analytics cannot provide. Knowing that 15 visitors this month left comments saying “I couldn’t find the pricing” reveals a content gap that no amount of traffic data would surface.
Hotjar’s Surveys enable more structured qualitative research, exit surveys asking why visitors are leaving, post-purchase surveys collecting customer satisfaction data, or NPS (Net Promoter Score) surveys measuring brand loyalty. For bloggers who want to understand their audience beyond traffic metrics, surveys provide the “why” that analytics data cannot.
Where Hotjar falls short
Hotjar does not replace GA4 for traffic analytics, it has no traffic source data, no audience demographics, no keyword integration, and no goal conversion funnel that tracks traffic sources through to conversion. Hotjar answers “what are visitors doing?” while GA4 answers “who are these visitors and where did they come from?”, both questions matter, and both tools are needed for complete understanding.
The free plan’s 35 daily session recordings is limiting for sites with significant traffic, a blog with 1,000 daily visitors captures only 3.5% of sessions for analysis. The Plus plan at $32/month increases this to 100 daily sessions, more useful, still a sample of total traffic.
Hotjar’s session recording data retention is limited on lower plans, recordings expire after a set period, limiting historical analysis.
Hotjar pricing
Plan | Price/month (annual) | Daily sessions | Key features |
Free | $0 | 35 | Unlimited heatmaps, basic recordings |
Plus | $32 | 100 | + Filters, events, trends |
Business | $80 | 500 | + Funnels, console tracking, frustration signals |
Scale | $171 | 500+ | + SSO, dedicated support, unlimited everything |
Hotjar: Pros and Cons
Pros:
– Best heatmap tool, click, scroll, and move maps reveal user behaviour
– Session recordings show exactly what individual visitors do on your site
– Funnel analysis identifies conversion drop-off points
– Feedback widget collects qualitative visitor input
– Surveys for structured audience research
– Free plan includes unlimited heatmaps, genuinely useful
– 25% recurring affiliate commission
Cons:
– Does not replace GA4, no traffic source or audience data
– Free plan limited to 35 daily session recordings
– Session recording sample is small for high-traffic sites
– Data retention limits on lower plans
– Requires both Hotjar and GA4 for complete analytics picture
Rating: 4.6 / 5, Best behaviour analytics tool. Essential complement to GA4 for understanding why visitors behave the way they do on your pages.
Matomo Review: Best Privacy-First Analytics Platform
Free plan: Yes, Matomo On-Premise (self-hosted) is completely free
Starting paid price: $23/month (Cloud, billed annually, up to 50k pageviews)
Best plan for most privacy-conscious users: Cloud, $23/month or self-hosted free
Platforms: Web, iOS, Android
Affiliate program: Yes, Matomo affiliate program, 20% recurring commission
Matomo is the most widely used privacy-first web analytics platform the leading alternative to Google Analytics for website owners who want comprehensive traffic data without sending visitor information to Google’s servers. It is GDPR-compliant by design, supports cookieless tracking, and, in its self-hosted version, keeps all your analytics data entirely on your own servers where no third party can access it.
What Matomo does best
Matomo’s privacy architecture is its defining advantage. Unlike GA4, which sends all visitor data to Google’s servers (raising GDPR compliance concerns and creating dependency on Google’s data policies), Matomo’s self-hosted version processes and stores all analytics data on your own server, never leaving your control. This makes Matomo the preferred analytics solution for healthcare organisations, government websites, legal firms, and any business operating under strict data privacy requirements.
The GDPR compliance advantage extends to consent requirements. Matomo’s cookieless tracking, available in the cloud and self-hosted versions, measures traffic without cookies, meaning visitor data is collected even from visitors who decline cookie consent banners. For websites with significant European traffic where GDPR consent banners cause 30–50% of visitors to opt out of GA4 tracking, Matomo’s cookieless mode preserves data completeness that GA4 loses.
Matomo’s feature set is the closest to GA4 of the three tools, it provides traffic source analytics, audience demographics, page performance data, conversion goal tracking, e-commerce analytics, and custom reports that rival GA4’s capabilities. For organisations replacing Google Analytics entirely for privacy reasons, Matomo is the most feature-complete replacement available.
The self-hosted version is completely free, you pay only for your web hosting (typically included in existing hosting) and manage the software yourself. For bloggers already on WordPress hosting with sufficient server resources, Matomo self-hosted is a zero-cost analytics solution with no data sharing.
Matomo’s Tag Manager, included in all versions, manages marketing tags, conversion pixels, and analytics tracking without requiring developer access for each new tag. For bloggers running Facebook Ads, Google Ads, and email marketing alongside organic content, centralised tag management reduces technical overhead.
Matomo Cloud, the hosted version, removes the self-hosting maintenance burden at $23/month for up to 50,000 monthly pageviews. For bloggers who do not want to manage their own server but want privacy-compliant analytics, Matomo Cloud provides GA4-comparable features with full data ownership and no Google dependency.
Heatmaps and session recordings are available in Matomo, included in the Cloud version and as a paid plugin for self-hosted. While not as polished as Hotjar’s dedicated behaviour analytics, Matomo’s built-in heatmaps eliminate the need for a separate Hotjar subscription for privacy-conscious users who want basic behaviour analytics alongside traffic data.
Where Matomo falls short
Matomo’s interface is less polished than GA4, the dashboard and report design feel slightly dated compared to Google’s continuously refined interface. New users familiar with GA4 may find Matomo’s navigation less intuitive despite comparable underlying capabilities.
Self-hosted Matomo requires server administration, installing the software, managing updates, and maintaining server performance. For non-technical bloggers, the self-hosted option adds maintenance overhead that the cloud version eliminates at the cost of a monthly fee.
Matomo’s integrations, while comprehensive, are less extensive than GA4’s, particularly for Google Ads and Google Search Console. Bloggers who run paid search campaigns and want attribution data connected to keyword performance are better served by GA4’s native Google integrations.
The community and third-party ecosystem is smaller than GA4’s, fewer agencies, tools, and plugins are built around Matomo, meaning some advanced analytical workflows require custom implementation.
Matomo pricing
Plan | Price/month (annual) | Pageviews | Key features |
Self-hosted | $0 | Unlimited | Full analytics, self-managed |
Cloud Starter | $23 | 50,000/month | Full analytics, Matomo-managed |
Cloud Business | $54 | 200,000/month | + Priority support |
Cloud Enterprise | Custom | Unlimited | + SLA, dedicated support |
Matomo: Pros and Cons
Pros:
– Best privacy compliance, self-hosted keeps all data on your server
– Cookieless tracking preserves data from consent-declining visitors
– Self-hosted version completely free, no ongoing cost
– Most comprehensive GA4 alternative, comparable traffic analytics features
– Built-in heatmaps and session recordings (Cloud/plugin)
– Full data ownership, no third-party access to your analytics data
– GDPR, CCPA, and HIPAA compliant by design
– 20% recurring affiliate commission
Cons:
– Interface less polished than GA4
– Self-hosted requires server administration knowledge
– Less extensive Google integrations (Ads, Search Console)
– Smaller third-party ecosystem than GA4
– Cloud version adds monthly cost for what GA4 provides free
– Less intuitive for users familiar with GA4’s interface
Rating: 4.4 / 5 — Best privacy-first analytics platform. Essential for privacy-conscious websites and the best GA4 replacement for GDPR-sensitive use cases.
Head-to-Head Comparison
Google Analytics 4 | Hotjar Plus | Matomo Cloud | |
Price/month | Free | $32 | $23 |
Pricemontha | Yes (unlimited) | Yes (35 sessions/day) | Self-hosted free |
Traffic analytics | Excellent | None | Excellent |
Audience demographics | Excellent | None | Good |
Heatmaps | No | Excellent | Basic (included) |
Session recordings | No | Excellent | Basic (included) |
Conversion funnels | Good | Good | Good |
Feedback/surveys | No | Yes | No |
Google Search Console | Yes (native) | No | Plugin |
Google Ads integration | Yes (native) | No | Limited |
Privacy/GDPR compliance | Moderate (consent required) | Good | Excellent |
Cookieless tracking | Limited | No | Yes |
Data ownership | Google’s servers | Hotjar’s servers | Your server (self-hosted) |
Self-hosted option | No | No | Yes (free) |
Affiliate commission | None | 25% recurring | 20% recurring |
Which Analytics Tool Should You Choose?
The honest answer: you need at least two of these tools, not one.
These three tools answer different questions. GA4 tells you where traffic comes from and how much. Hotjar tells you what visitors do when they arrive. Matomo provides privacy-compliant traffic data for audiences where GA4’s cookie requirements create gaps.
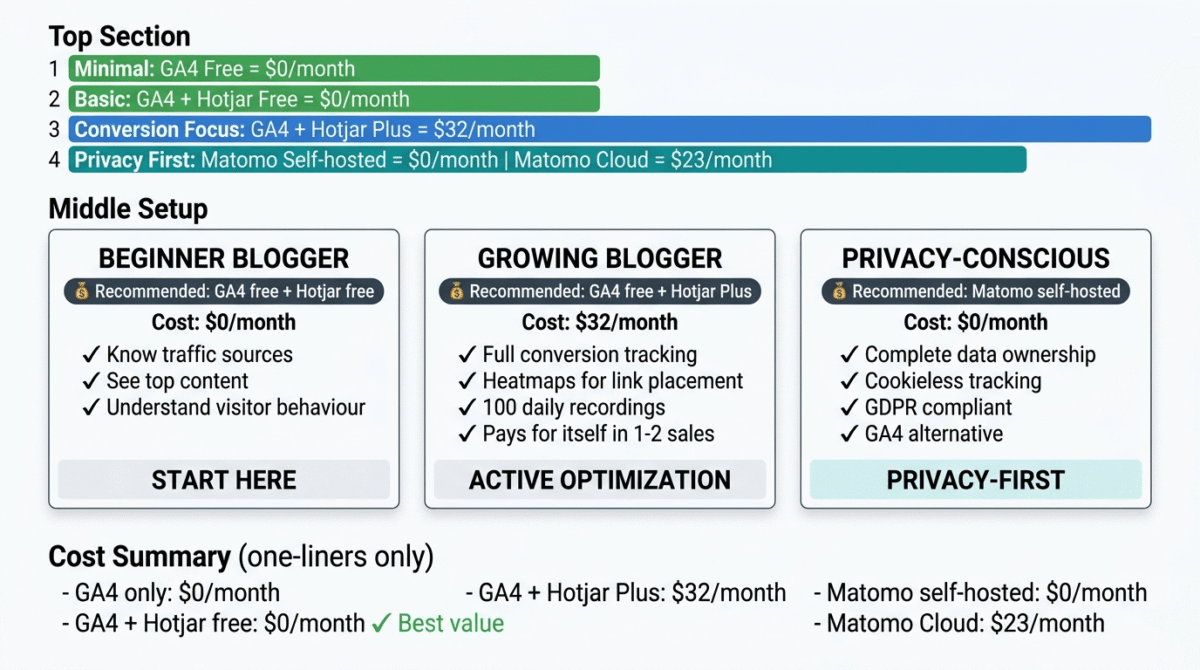
The recommended setup for most bloggers:
Start with GA4 + Hotjar free: GA4 is free and essential, install it on day one. Hotjar’s free plan with unlimited heatmaps and 35 daily session recordings costs nothing and immediately reveals how visitors interact with your most important pages. This combination answers 80% of the questions bloggers need to improve their sites.
Add Matomo self-hosted if privacy matters to you: If significant European traffic or specific privacy commitments make GA4’s data sharing unacceptable, install Matomo self-hosted on your existing WordPress hosting at zero additional cost. Run it alongside GA4 during a transition period, then evaluate which provides more actionable data for your specific needs.
Upgrade Hotjar to Plus ($32/month) when you are actively optimising conversions, testing landing pages, improving affiliate click rates, or diagnosing checkout abandonment. The 100 daily session recordings on Plus provide enough sample for meaningful conversion analysis.
Setting Up Analytics on Your WordPress Blog, The Practical Guide
Step 1, Install Google Analytics 4 (day 1, free):
– Create a GA4 property at analytics.google.com
– Install MonsterInsights plugin on WordPress (free version)
– Connect MonsterInsights to your GA4 property, tracking code installed automatically
– Set up conversion events for affiliate link clicks and email opt-in submissions
**Step 2, Connect Google Search Console (day 1, free):
– Create a Search Console property at search.google.com/search-console
– Verify ownership via your GA4 property (one-click connection)
– Submit your sitemap (yourdomain.com/sitemap.xml)
– Connect Search Console to GA4 for keyword-level traffic data
Step 3, Install Hotjar (day 1, free):
– Create a Hotjar account at hotjar.com
– Install the Hotjar tracking code via MonsterInsights or Insert Headers and Footers plugin
– Create heatmaps for your homepage, top blog posts, and any affiliate review pages
– Enable session recordings for your highest-traffic pages
Step 4, Review your data weekly (ongoing):
– GA4: Check top pages by traffic, traffic sources, and conversion events
– Hotjar: Review heatmaps for your top affiliate posts monthly
– Search Console: Monitor keyword rankings and click-through rates weekly
– Combined: Identify your highest-traffic, lowest-converting pages, these are your optimisation priorities
This setup takes under two hours and costs nothing, yet provides more actionable data than most bloggers ever use.
Final Verdict
Google Analytics 4 is non-negotiable, every blogger needs it, it is completely free, and it provides the foundational traffic data that every other analytics decision depends on. Install it on day one.
Hotjar is the best complement to GA4 the heatmaps and session recordings that reveal why visitors behave the way they do on your pages are the most direct path to improving affiliate conversion rates, email opt-in rates, and overall engagement. The free plan covers basic needs; Plus at $32/month is worth it when active conversion optimisation justifies the investment.
Matomo is the best GA4 replacement for privacy-conscious users, the self-hosted version’s zero cost, complete data ownership, and cookieless tracking capabilities make it the most compelling alternative for websites where GDPR compliance and data privacy are primary concerns.
Ratings:
– Google Analytics 4: 4.7 / 5
– Hotjar: 4.6 / 5
– Matomo: 4.4 / 5
Frequently Asked Questions
Do I need Google Analytics for my blog?
Yes, Google Analytics 4 is the foundational analytics tool for any serious blog. It is completely free, shows exactly where your traffic comes from, which content performs best, and what actions visitors take on your site. Without it, you cannot make data-driven decisions about content, promotion, or monetization. Install it before publishing your first post.
What is the difference between Google Analytics and Hotjar?
Google Analytics 4 measures traffic, how many visitors, where they came from, which pages they visited, and what they converted on. Hotjar measures behaviour, what visitors do on individual pages, where they click, how far they scroll, and where they get confused or frustrated. Both are necessary for a complete understanding of your website’s performance. GA4 tells you what is happening at the macro level; Hotjar explains why at the individual page level.
Is Hotjar free?
Yes. Hotjar’s free plan includes unlimited heatmaps (click, scroll, and move maps for any page) and 35 daily session recordings, a genuine and useful free tier. For bloggers who want to understand how visitors interact with their key pages without spending money, Hotjar free combined with GA4 free provides a powerful analytics foundation at zero cost.
Is Matomo better than Google Analytics?
For privacy compliance, yes, Matomo’s self-hosted version keeps all data on your server with no third-party access, supports cookieless tracking, and is GDPR-compliant by design. For features and integrations, GA4 is more comprehensive, particularly for Google Search Console and Google Ads integration. For most bloggers, GA4’s free capabilities and Google ecosystem integrations make it the better choice unless specific privacy requirements make Matomo’s data ownership model necessary.
Does Google Analytics slow down my website?
Google Analytics adds a small JavaScript file that loads with your pages, typically adding 10–50ms to page load time depending on your hosting and cache configuration. With proper caching (WP Rocket), a CDN (Cloudflare), and the async loading that MonsterInsights implements by default, the performance impact is minimal. Google Analytics should not meaningfully affect your Core Web Vitals scores on a properly optimised WordPress site.
What analytics tools do professional bloggers use?
Most professional bloggers use Google Analytics 4 as their primary traffic analytics tool, it is the industry standard and integrates with more third-party tools than any alternative. Many also use Hotjar or Microsoft Clarity (a free Hotjar alternative) for behaviour analytics, and some use Semrush or Ahrefs (reviewed separately) for SEO analytics. Google Search Console free, is universally used alongside GA4 for keyword-level search data.
What is cookieless tracking and why does it matter?
Cookieless tracking measures website visitors without placing cookies on their devices, no consent banner required. This matters because GDPR and similar privacy regulations require explicit consent before placing analytics cookies, and a significant percentage of European visitors decline consent, creating gaps in cookie-dependent analytics data. Matomo’s cookieless tracking uses server-side methods to measure traffic from all visitors regardless of cookie consent decisions, producing more complete data for sites with significant European audiences.
How do I track affiliate link clicks in Google Analytics?
Use MonsterInsights (WordPress plugin) with its affiliate link tracking feature, it automatically tracks clicks on outbound links, including affiliate links, as GA4 events. Alternatively, configure GA4 manually by adding an outbound click event trigger in Google Tag Manager. Once configured, your GA4 conversion reports show exactly how many clicks each affiliate link received, which pages generated those clicks, and which traffic sources sent the visitors who clicked. This data is essential for understanding which affiliate links perform and which need better placement or context.