Website speed is not just a user experience metric, it is a direct Google ranking factor. Since Google’s Core Web Vitals became a confirmed ranking signal, slow websites are penalised in search results regardless of content quality. A blog post that deserves to rank on page 1 but loads in 6 seconds will consistently lose to a comparable post that loads in 1.5 seconds.
For bloggers and WordPress developers, understanding exactly why a site is slow, and what to fix, requires more than a single speed number. It requires diagnostic data: which specific resources are largest, which render-blocking elements delay content display, which third-party scripts add the most load time, and how the site performs for real users in different geographic locations.
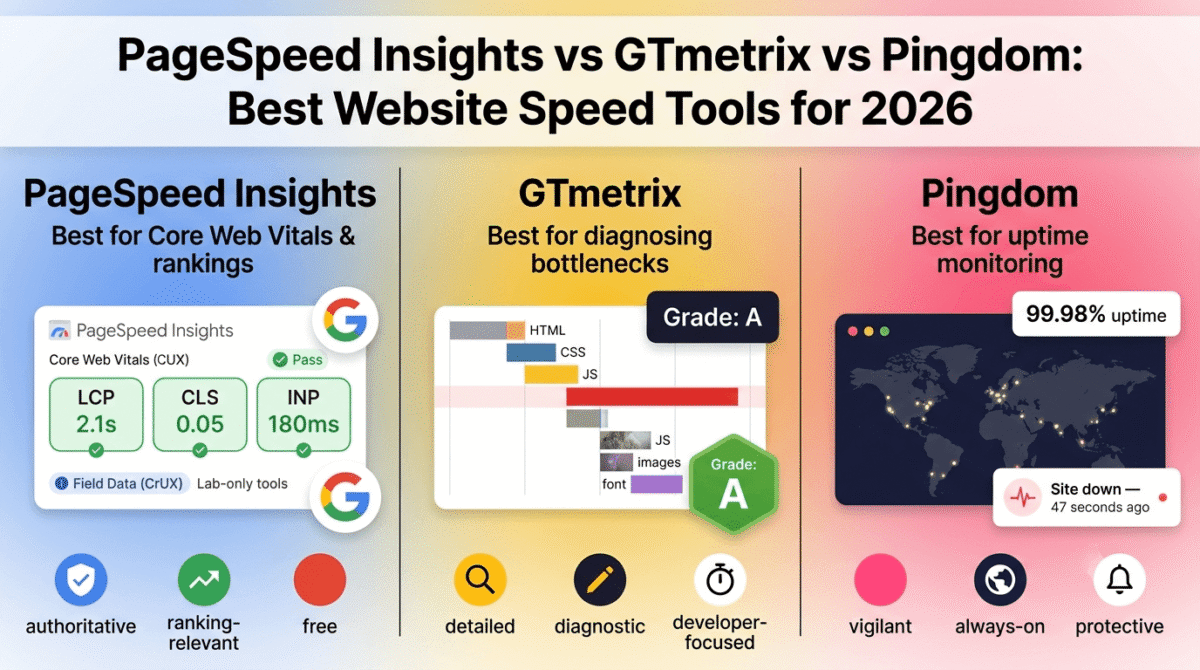
That is what website speed tools provide. And in 2026, three tools define this category, GTmetrix vs PageSpeed Insights vs Pingdom Website Speed Test. Each measures speed differently, surfaces different diagnostic information, and serves different use cases.
I tested all three on real WordPress sites across different hosting environments, themes, and plugin configurations. Here is the honest comparison.
Table of Contents
How We Evaluated These Tools
Every tool was tested across five criteria:
- Accuracy, how reliably does the score reflect real-world user experience?
- Diagnostic depth, how specifically does the tool identify what to fix?
- Core Web Vitals coverage, how well does it measure LCP, CLS, and INP?
- Geographic testing, can you test from locations relevant to your audience?
- Value, free plan quality and paid plan pricing versus features offered
Why Website Speed Matters More Than Ever in 2026
Before comparing the tools, understanding what speed affects helps prioritise the work:
Google Rankings. Core Web Vitals, Largest Contentful Paint (LCP), Cumulative Layout Shift (CLS), and Interaction to Next Paint (INP), are confirmed Google ranking signals. Sites that pass Core Web Vitals thresholds receive a ranking boost over equivalent content on slower sites. The PageSpeed Insights tool measures these signals directly from Google’s real-user data.
AdSense Revenue. Faster pages display ads more quickly, increasing viewable impressions and RPM. Google’s research shows that pages loading in under 1 second have a 32% lower bounce rate than pages loading in 3 seconds. Lower bounce rates mean more ad impressions per session, directly increasing AdSense revenue.
Affiliate Conversion Rates. Visitors who experience slow page loads convert at dramatically lower rates, Amazon found that every 100ms of additional load time reduced sales by 1%. For affiliate review posts, a visitor who leaves before the page loads is an affiliate click that never happened.
Mobile Experience. In 2026, over 60% of web traffic is mobile. Mobile connections are slower and more variable than desktop, a page that loads acceptably on desktop Wi-Fi may be frustratingly slow on a 4G connection. Testing from mobile and testing from multiple geographic locations (including South Asia) surfaces performance issues that desktop-only testing misses.
Google PageSpeed Insights Review: Best Free Speed Tool for Core Web Vitals
Free plan: Yes, completely free, unlimited tests
Starting price: Free forever
Platforms: Web (pagespeed.web.dev or via Google Search Console)
Affiliate program: None, Google tool
Google PageSpeed Insights (PSI) is the most authoritative website speed tool available, because it uses Google’s own data to score your site. The scores and recommendations come directly from the same systems Google uses to evaluate websites for search ranking purposes. If you want to know how Google sees your site’s performance, PageSpeed Insights is the definitive source.
What PageSpeed Insights does best
PageSpeed Insights’ Core Web Vitals measurement is its most important and unique capability. Unlike GTmetrix and Pingdom, which measure your site from their own servers in a controlled lab environment, PageSpeed Insights combines lab data (a synthetic test from Google’s servers) with field data, real performance measurements from actual Chrome browser users visiting your site, collected via the Chrome User Experience Report (CrUX).
This field data distinction is critical. Lab tests measure how your site performs under ideal conditions with a consistent connection and device. Field data measures how real users on real devices with real connections actually experience your site. The gap between lab performance (often good) and field performance (often worse) reveals issues that controlled testing cannot surface, mobile users on 4G connections, users with older devices, and geographic performance variations.
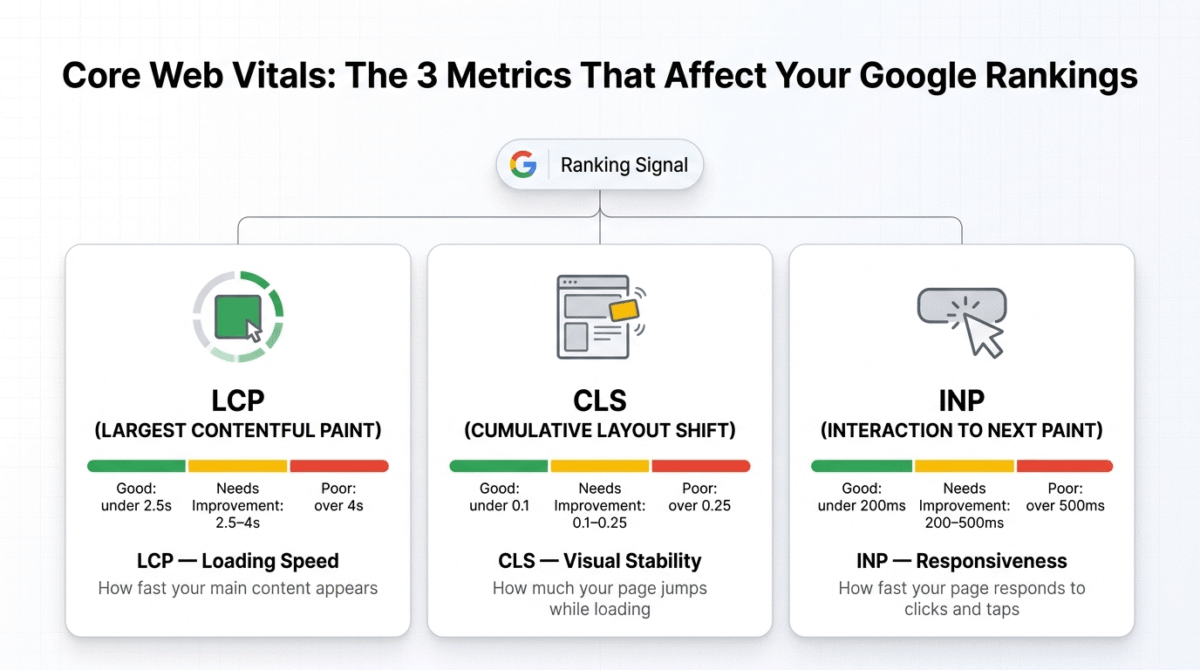
The Core Web Vitals assessment, Pass or Fail for LCP, CLS, and INP, is the most directly actionable speed information for SEO purposes. Google uses these same thresholds for its ranking evaluation:
- LCP (Largest Contentful Paint): Good = under 2.5 seconds, Needs Improvement = 2.5–4 seconds, Poor = over 4 seconds
- CLS (Cumulative Layout Shift): Good = under 0.1, Needs Improvement = 0.1–0.25, Poor = over 0.25
- INP (Interaction to Next Paint): Good = under 200ms, Needs Improvement = 200–500ms, Poor = over 500ms
The Opportunities section, specific recommendations for improving your score, is the most actionable diagnostic output of the three tools. Each opportunity shows the estimated time savings from implementing the fix, prioritising which improvements will have the largest performance impact. “Eliminate render-blocking resources (estimated savings: 1.2s)” tells you not just that there is a problem but how much fixing it would help.
The Diagnostics section surfaces additional performance issues beyond the scored opportunities, image sizing, DOM size, JavaScript execution time, and third-party script impact, providing a comprehensive performance audit in a single free tool.
The integration with Google Search Console enables monitoring Core Web Vitals trends over time for your entire site, identifying which pages fail Core Web Vitals across your domain rather than testing one URL at a time.
Where PageSpeed Insights falls short
PageSpeed Insights’ field data requires sufficient real user traffic to generate meaningful CrUX data, new websites or low-traffic pages may not have enough Chrome user visits for field data to appear. For new blogs, the lab data is all that is available until traffic builds.
The tool tests one URL at a time and does not provide scheduled monitoring, you must manually test each page rather than receiving automatic alerts when performance degrades. GTmetrix and Pingdom’s monitoring features fill this gap.
The score (0–100) is sometimes confusing because a “good” score in real-world terms does not always require a 90+ score, what matters is passing Core Web Vitals thresholds rather than maximising the numerical score.
PageSpeed Insights: Pros and Cons
Pros:
- Only tool using real Google field data, most authoritative for SEO purposes
- Best Core Web Vitals measurement, Pass/Fail assessment matching Google’s ranking criteria
- Most actionable Opportunities section with estimated savings per fix
- Google Search Console integration for site-wide monitoring
- Completely free, unlimited tests
- Mobile and desktop testing in one tool
- Most directly relevant to Google rankings
Cons:
- No scheduled monitoring or performance alerts
- New/low-traffic sites lack field data
- Tests one URL at a time, no bulk testing
- No geographic server selection
- No waterfall chart as detailed as GTmetrix
- Score alone (without Core Web Vitals context) can be misleading
Rating: 4.8 / 5, The most important free website speed tool. Use it first, the Core Web Vitals assessment is the most SEO-relevant performance measurement available.
GTmetrix Review: Best Diagnostic Speed Tool for Developers and WordPress Optimisers
Free plan: Yes, 10 tests/month from Vancouver server
Starting price: $4.25/month (Solo, billed annually)
Best plan for most users: Free or Solo, $4.25/month
Platforms: Web
Affiliate program: Yes, GTmetrix affiliate program, 30% commission
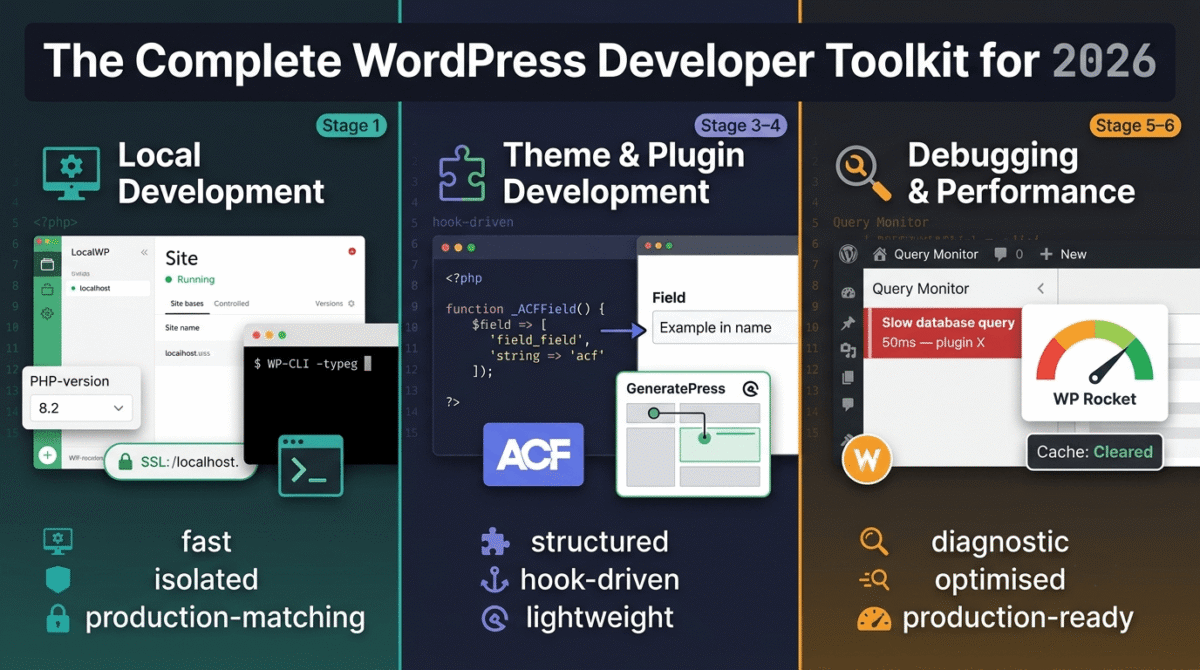
GTmetrix is the most detailed diagnostic speed tool available, providing a comprehensive waterfall chart, performance analysis by resource type, and the specific technical recommendations that developers and WordPress optimisers need to identify and fix performance bottlenecks. See our complete WordPress developer toolkit guide for the rest of the stack GTmetrix’s diagnostics typically feed into. While PageSpeed Insights tells you what to fix, GTmetrix shows you exactly what is happening during page load at a granular level.
What GTmetrix does best
GTmetrix’s waterfall chart is its most powerful diagnostic feature, a visual timeline showing every resource (HTML, CSS, JavaScript, images, fonts, third-party scripts) loaded during a page request, with precise timing for each resource’s DNS lookup, connection, time-to-first-byte, download, and execution phases.
For WordPress developers troubleshooting slow page loads, the waterfall chart answers the critical diagnostic questions:
Which resources take the longest to load? A 2MB unoptimised hero image loading before any content renders is immediately visible as a giant bar blocking everything else.
Which third-party scripts add the most load time? A Facebook Pixel, a Google Fonts call, a Hotjar script, and an Intercom chat widget each add loading time, the waterfall shows exactly how much each contributes and whether they block rendering.
Are resources loading in the optimal order? Render-blocking CSS and JavaScript that delay the browser from displaying content are visually obvious in the waterfall, large blocks of blue (waiting) before any content appears indicate render-blocking resources.
Is browser caching configured correctly? Resources that should be cached (returning visitor loads) but are re-downloaded on every visit appear with their full download time on repeat page loads, the waterfall’s Repeat View option shows what a returning visitor experiences.
The GTmetrix Grade, combining PageSpeed and YSlow scores into a letter grade (A through F), provides a quick headline metric alongside the detailed diagnostics. The Structure tab translates the grade into specific prioritised recommendations with explanations of each issue.
Geographic server selection, testing from London, Sydney, São Paulo, Mumbai, and other locations, is GTmetrix’s most practically valuable paid feature. For bloggers targeting South Asian audiences, testing from Mumbai or Singapore reveals the page load experience readers actually experience, which is often significantly worse than the Vancouver server result on the free plan.
Video recording, capturing a visual timeline of how your page loads, showing exactly when different elements become visible, is the most intuitive way to understand the perceived load experience. The filmstrip comparison shows side-by-side load progression at 100ms intervals, making the difference between a fast and slow version of your site visually obvious.
Scheduled monitoring, automatically testing your site daily or weekly and sending email alerts when performance drops below a threshold, catches performance regressions caused by plugin updates, new images, or theme changes before they affect significant traffic.
Where GTmetrix falls short
GTmetrix’s free plan limits you to 10 tests per month from Vancouver, Canada, unhelpful for websites whose audiences are not in North America. The most useful geographic servers (London, Mumbai, Sydney) require paid plans.
GTmetrix does not use real user field data, all measurements are lab-based synthetic tests from GTmetrix’s own servers. This means GTmetrix scores can be more optimistic than real user experience for some sites, and they do not directly reflect Google’s Core Web Vitals assessment from actual Chrome users.
The detailed waterfall chart, while powerful for developers, can overwhelm non-technical users who want straightforward actionable guidance rather than granular timing data.
GTmetrix pricing
Plan | Price/month (annual) | Tests/month | Locations | Key features |
Free | $0 | 10 | Vancouver only | Basic analysis, waterfall |
Solo | $4.25 | 50 | 7 locations | + Video, alerts, API |
Starter | $14.25 | 200 | All locations | + More alerts, comparisons |
Growth | $23.92 | 500 | All locations | + Team features |
GTmetrix: Pros and Cons
Pros:
- Best waterfall chart, most detailed resource timing analysis
- Geographic server selection for audience-relevant testing
- Video recording of page load for visual performance analysis
- Scheduled monitoring with performance alerts
- Historical performance tracking over time
- Most useful for developers diagnosing specific bottlenecks
- 30% affiliate commission
Cons:
- Lab data only, no real user field data
- Free plan limited to Vancouver server and 10 tests/month
- Less directly relevant to Google SEO ranking than PageSpeed Insights
- Waterfall complexity can overwhelm non-technical users
- Paid plan required for geographic testing and monitoring
Rating: 4.6 / 5, Best diagnostic speed tool for developers and WordPress optimisers. The waterfall chart makes it indispensable for identifying and fixing specific performance bottlenecks.
Pingdom Review: Best Website Speed and Uptime Monitoring Tool
Free plan: No (14-day free trial)
Starting price: $10/month (Synthetic Monitoring, billed annually)
Best plan for most users: Synthetic Monitoring, $10/month
Platforms: Web, iOS, Android
Affiliate program: Yes, Pingdom affiliate program, 20% commission
Pingdom is the most comprehensive website monitoring platform, combining page speed testing with uptime monitoring (alerting you when your site goes down), transaction monitoring (testing whether specific user flows work correctly), and real user monitoring (measuring performance from actual visitors). For bloggers and small businesses where website downtime directly affects income, Pingdom’s uptime monitoring is its most practically valuable capability.
What Pingdom does best
Pingdom’s uptime monitoring, checking your website every minute from multiple global locations and sending immediate email, SMS, or Slack alerts when it goes down, is the feature that most directly protects blogger and small business income. An affiliate blog that is down for 4 hours loses both AdSense revenue and affiliate link clicks from traffic that arrives during the outage. Knowing within 60 seconds rather than hours later enables immediate response, contacting your host, investigating the issue, and minimising downtime duration.
The waterfall analysis in Pingdom’s speed test is comparable to GTmetrix’s, showing resource-by-resource load timing, content type breakdown, and request count. The performance grade and recommendations are presented more accessibly than GTmetrix’s technical detail, making Pingdom’s speed report more useful for non-developer website owners who want clear guidance without deep technical context.
Geographic testing covers 70+ locations, the most extensive geographic coverage of the three tools, enabling testing from locations precisely matching your audience.
Transaction monitoring, scripted tests that check whether specific multi-step user flows work correctly (login → browse product → add to cart → checkout, or subscribe form → email confirmation flow), provides functional testing beyond pure performance measurement. For bloggers with email opt-in forms, contact forms, or checkout processes, transaction monitoring alerts you when these critical flows break rather than discovering broken funnels from lost leads and revenue.
Real User Monitoring (RUM), injecting a lightweight script into your pages that measures actual visitor performance, provides genuine field data comparable to Google’s CrUX but for all browsers (not just Chrome) and available without the traffic threshold required for CrUX data.
Where Pingdom falls short
Pingdom has no free plan, the 14-day trial provides evaluation opportunity but paid commitment is required for ongoing use. For bloggers who want monitoring without a subscription, UptimeRobot (free for basic uptime monitoring) covers the most critical use case at zero cost.
The page speed score and recommendations, while accessible, are less comprehensive than GTmetrix’s waterfall detail and less SEO-relevant than PageSpeed Insights’ Core Web Vitals assessment. Pingdom’s sweet spot is monitoring rather than one-time diagnostic testing.
The starting price ($10/month) is higher than GTmetrix Solo ($4.25/month) for speed testing alone, Pingdom’s value is maximised when uptime monitoring and transaction monitoring are needed alongside speed testing.
Pingdom pricing
Plan | Price/month (annual) | Checks | Locations | Key features |
Synthetic Monitoring | $10 | 10 uptime checks | 70+ | Uptime, speed tests, alerts |
Advanced | $40 | 50 checks | 70+ | + More checks, SMS alerts |
Professional | $100 | 100 checks | 70+ | + Transaction monitoring |
Custom | Contact sales | Unlimited | 70+ | + RUM, advanced reporting |
Pingdom: Pros and Cons
Pros:
- Best uptime monitoring, 60-second checks with immediate alerts
- Most geographic test locations, 70+ worldwide
- Transaction monitoring for functional flow testing
- Real User Monitoring for genuine field performance data
- Accessible performance reports for non-technical users
- iOS and Android apps for monitoring on mobile
- 20% affiliate commission
Cons:
- No free plan, paid subscription required
- Most expensive of the three tools for speed testing alone
- Speed diagnostic less detailed than GTmetrix for developers
- Core Web Vitals assessment less authoritative than PageSpeed Insights
- Value maximised with uptime monitoring, overkill if speed testing only needed
Rating: 4.4 / 5, Best website monitoring platform for bloggers and businesses where uptime directly affects income. Less compelling as a standalone speed testing tool versus PageSpeed Insights and GTmetrix.
Head-to-Head Comparison
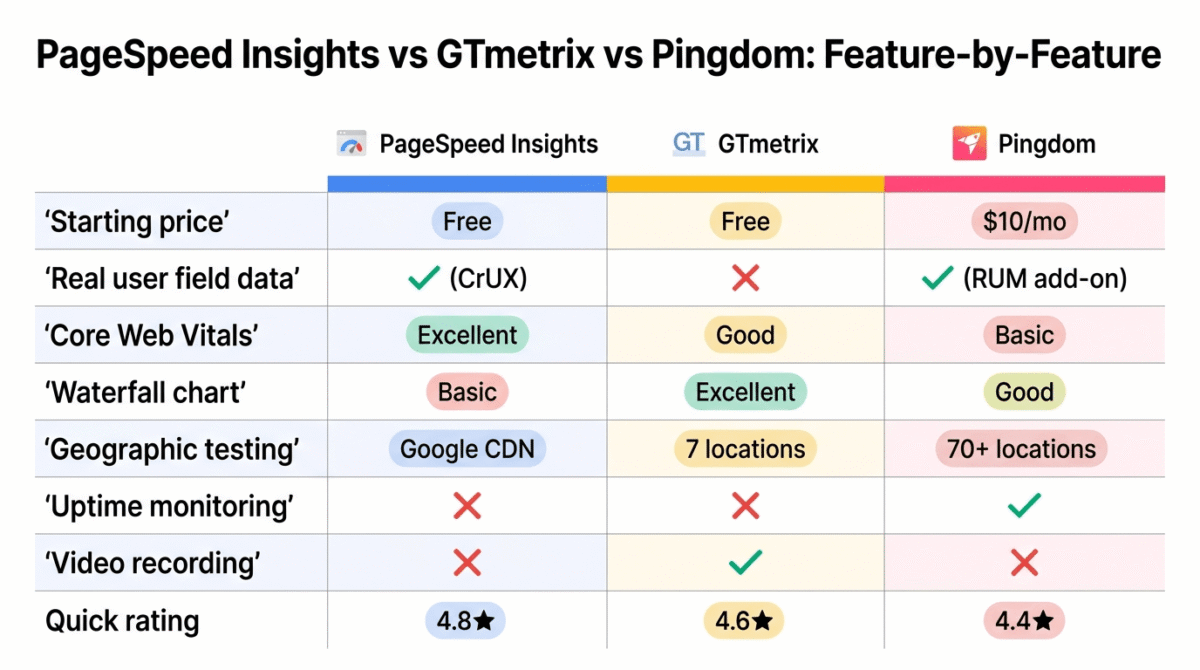
PageSpeed Insights | GTmetrix Free | GTmetrix Solo | Pingdom | |
Price/month | Free | Free | $4.25 | $10 |
Real user field data | Yes (CrUX) | No | No | Yes (RUM add-on) |
Core Web Vitals | Excellent | Good | Good | Basic |
Waterfall chart | Basic | Excellent | Excellent | Good |
Geographic testing | None (Google CDN) | Vancouver only | 7 locations | 70+ locations |
Uptime monitoring | No | No | No | Yes |
Transaction monitoring | No | No | No | Yes (Professional) |
Scheduled monitoring | Via Search Console | No | Yes | Yes |
Performance alerts | No | No | Yes | Yes |
Mobile testing | Yes | Yes | Yes | Yes |
Historical tracking | Via Search Console | Limited | Yes | Yes |
Video recording | No | No | Yes | No |
API access | Yes (free) | No | Yes | Yes |
Best for | SEO/rankings | Developer diagnosis | Developer + monitoring | Uptime + monitoring |
Which Website Speed Tool Should You Choose?
The honest answer: use all three, for different purposes.
These tools are not direct competitors, they answer different questions about your website’s performance:
Use PageSpeed Insights for: Understanding your Google ranking-relevant performance. Check every page you want to rank competitively. Fix issues flagged in the Opportunities section. Monitor Core Web Vitals in Google Search Console for your entire site.
Use GTmetrix for: Diagnosing specific performance bottlenecks. When PageSpeed Insights tells you there is a render-blocking resource, GTmetrix’s waterfall shows you exactly which file it is and how long it takes. When a plugin update slows your site, GTmetrix’s comparison tool shows before and after performance side by side.
Use Pingdom for: Monitoring uptime when your blog is generating income. A $10/month investment that alerts you within 60 seconds of downtime is worthwhile for any blog earning $500+/month, the downtime revenue protection and ability to respond immediately typically justifies the cost quickly.
The WordPress Speed Optimisation Checklist
For WordPress bloggers and developers who have identified performance issues through the tools above, here is the systematic fix order:
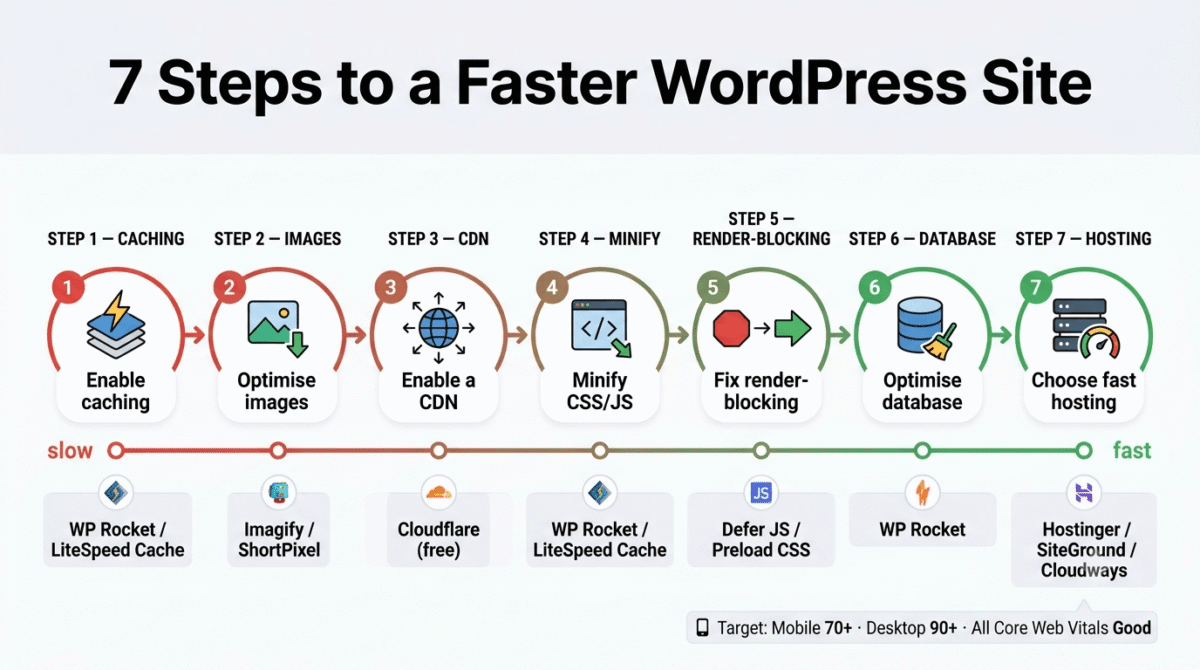
Step 1, Enable caching (largest impact):
Install LiteSpeed Cache (if on Hostinger/LiteSpeed hosting) or WP Rocket ($59/year). Page caching serves pre-built HTML to visitors instead of generating it dynamically, typically the single largest performance improvement available.
Step 2, Optimise images:
Install Imagify or ShortPixel, automatic compression reduces image file sizes by 40–80% without visible quality loss. Convert all images to WebP format (smaller than JPEG at equivalent quality, supported by all modern browsers). For the full stack beyond just caching and image compression, see our roundup of performance plugins and other essentials every WordPress site should run.
Step 3, Enable a CDN:
Connect Cloudflare (free), serves static assets (images, CSS, JavaScript) from servers geographically close to each visitor, reducing the distance data travels and improving load times globally.
Step 4, Minify CSS and JavaScript:
WP Rocket or LiteSpeed Cache handle CSS and JavaScript minification, removing whitespace, comments, and redundant code reduces file sizes without affecting functionality.
Step 5, Fix render-blocking resources:
Defer non-critical JavaScript (load after page content, not before). Preload critical CSS. Remove unused CSS from plugins and themes that add stylesheets your site does not need.
Step 6, Optimise your database:
WP Rocket’s database optimisation removes post revisions, spam comments, and transients that accumulate over time, reducing database query time on every page load.
Step 7, Choose fast hosting:
All optimisation has diminishing returns on slow hosting. Hostinger’s LiteSpeed servers, SiteGround’s SuperCacher, and Cloudways’ cloud hosting provide the server response times that make all other optimisations more effective. Your hosting affects speed significantly more than any single plugin fix, see our Hostinger vs Bluehost vs SiteGround comparison if you suspect your host is the bottleneck.
Targets after optimisation:
- PageSpeed Insights: Mobile ≥ 70, Desktop ≥ 90
- Core Web Vitals: LCP < 2.5s, CLS < 0.1, INP < 200ms
- GTmetrix Grade: B or above (A is the target for competitive niches)
- Time to First Byte (TTFB): Under 500ms
Free Speed Tools Worth Knowing
Beyond the three primary tools:
WebPageTest.org (free): The most technically comprehensive free speed testing tool, advanced waterfall analysis, connection simulation, video comparison, and testing from 40+ global locations. Less beginner-friendly than GTmetrix but more powerful for advanced diagnostic use.
UptimeRobot (free): Free uptime monitoring with 5-minute check intervals and email alerts, covers the most critical monitoring use case at zero cost for bloggers not yet ready to invest in Pingdom.
Chrome DevTools (free): Built into Chrome browser, the Lighthouse audit (F12 → Lighthouse tab) runs a PageSpeed Insights-equivalent test locally, the Network tab provides a waterfall chart, and the Performance tab provides frame-by-frame rendering analysis for JavaScript-heavy performance issues.
Google Search Console (free): Core Web Vitals report shows field data performance for every page on your site, the most comprehensive free monitoring for SEO-relevant performance across your entire domain.
Final Verdict
Google PageSpeed Insights is the most important website speed tool for bloggers, the Core Web Vitals assessment is directly relevant to Google rankings, completely free, and the Opportunities section provides the most actionable fix guidance. Use it first for every page you want to rank.
GTmetrix is the best diagnostic tool for developers, the waterfall chart makes GTmetrix indispensable for identifying and fixing specific performance bottlenecks that PageSpeed Insights identifies but does not detail. GTmetrix Solo at $4.25/month adds geographic testing and monitoring.
Pingdom is the best choice when uptime monitoring matters, for blogs generating consistent income, the 60-second uptime alerts and transaction monitoring justify the $10/month subscription. Less compelling as a speed-testing-only tool.
Ratings:
- Google PageSpeed Insights: 4.8 / 5
- GTmetrix: 4.6 / 5
- Pingdom: 4.4 / 5
Frequently Asked Questions
What is the best free website speed test tool?
Google PageSpeed Insights is the best free website speed tool, it uses real user data from Chrome browsers visiting your site, measures the Core Web Vitals that Google uses as ranking signals, and provides specific recommendations with estimated improvement values. GTmetrix’s free plan adds waterfall analysis for developer-level diagnosis. Both are free and serve different diagnostic purposes.
What is a good PageSpeed Insights score?
The score (0–100) is less important than the Core Web Vitals assessment. A site scoring 65 but passing all three Core Web Vitals thresholds is better positioned for Google rankings than a site scoring 80 that fails LCP. Target: Mobile score ≥ 70 and Desktop score ≥ 90 as practical benchmarks, with all three Core Web Vitals in the “Good” range as the primary goal.
How do I speed up my WordPress site?
The highest-impact WordPress speed improvements in order: (1) enable page caching with WP Rocket or LiteSpeed Cache, (2) compress and convert images to WebP with Imagify, (3) connect Cloudflare CDN (free), (4) defer non-critical JavaScript, (5) switch to faster hosting if current host is the bottleneck. These five steps typically improve PageSpeed scores by 20–40 points and bring most WordPress sites within Core Web Vitals passing thresholds.
What are Core Web Vitals and why do they matter?
Core Web Vitals are three Google metrics measuring real user experience: LCP (how quickly the main content loads), CLS (how much the page layout shifts unexpectedly during loading), and INP (how quickly the page responds to user interactions). Google uses Core Web Vitals as a ranking signal, sites that pass all three thresholds receive a ranking boost over equivalent content on sites that fail them. PageSpeed Insights is the primary tool for measuring Core Web Vitals.
What is GTmetrix used for?
GTmetrix is primarily used for diagnosing specific website performance bottlenecks, the waterfall chart shows every resource loaded during a page request with precise timing, enabling developers to identify which specific files, scripts, or images are causing slowdowns. It is the most useful tool when you know your site is slow and need to find exactly what to fix.
Is Pingdom free?
No, Pingdom does not have a free plan. The Synthetic Monitoring plan starts at $10/month. For free uptime monitoring, UptimeRobot monitors websites every 5 minutes (versus Pingdom’s 1 minute) at zero cost, sufficient for most blogger monitoring needs. Pingdom’s value is in its 1-minute check interval, 70+ geographic testing locations, and transaction monitoring for critical user flows.